


Tata Consultancy Services (TCS) Option Chain
Live call and put premiums, open interest, change in OI, volume and IV by strike - 25 Jan 2027 expiry.
TCS future is at 2,442.20, so the at-the-money strike is 2,440. The ATM straddle costs 328.95, which prices in a move of about ±13.5% (2,113 to 2,771) by expiry, at an ATM IV of 37.8%. The highest call open interest is at 2,600 and the highest put open interest at 2,400. PCR (OI) is 0.85.
Data as of the last session · lot size 250 · ATM ±15 strikes and the highest-OI strikes of 46 · OI and volume in shares, premiums in ₹
| Calls | Puts | |||||||||
|---|---|---|---|---|---|---|---|---|---|---|
| OI | OI chg % | Volume | IV | LTP | Strike | LTP | IV | Volume | OI chg % | OI |
| 0 | – | 0 | 0.0 | 0.000.00 | 1,840 | 0.000.00 | 0.0 | 0 | – | 0 |
| 0 | – | 0 | 0.0 | 0.000.00 | 1,880 | 0.000.00 | 0.0 | 0 | – | 0 |
| 0 | – | 0 | 0.0 | 0.000.00 | 1,920 | 0.000.00 | 0.0 | 0 | – | 0 |
| 0 | – | 0 | 0.0 | 0.000.00 | 1,960 | 0.000.00 | 0.0 | 0 | – | 0 |
| 0 | – | 0 | 0.0 | 0.000.00 | 2,000 | 0.000.00 | 0.0 | 0 | – | 0 |
| 0 | – | 0 | 0.0 | 0.000.00 | 2,040 | 0.000.00 | 0.0 | 0 | – | 0 |
| 0 | – | 0 | 62.6 | 472.850.00 | 2,080 | 19.90−3.95 | 31.4 | 250 | – | 250 |
| 0 | – | 0 | 0.0 | 0.000.00 | 2,120 | 0.000.00 | 0.0 | 0 | – | 0 |
| 0 | – | 0 | 58.8 | 407.450.00 | 2,160 | 37.200.00 | 32.6 | 0 | – | 0 |
| 0 | – | 0 | 57.1 | 376.450.00 | 2,200 | 40.000.00 | 30.4 | 0 | 0.0% | 1.0 K |
| 0 | – | 0 | 55.7 | 346.800.00 | 2,240 | 55.300.00 | 31.8 | 0 | – | 0 |
| 0 | – | 0 | 54.3 | 318.350.00 | 2,280 | 53.25−13.00 | 27.8 | 500 | – | 500 |
| 0 | – | 0 | 53.1 | 291.200.00 | 2,320 | 64.90+0.90 | 27.3 | 750 | +33.3% | 3.0 K |
| 0 | – | 0 | 52.0 | 265.650.00 | 2,360 | 73.90+19.15 | 25.7 | 250 | 0.0% | 500 |
| 0 | – | 0 | 51.0 | 241.550.00 | 2,400 | 102.50+5.30 | 28.4 | 6.5 K | +39.0% | 14.3 K |
| 250 | 0.0% | 0 | 50.1 | 218.950.00 | 2,440 | 110.000.00 | 25.5 | 0 | 0.0% | 500 |
| Future 2,442.20 | ||||||||||
| 3.5 K | +7.7% | 250 | 29.6 | 112.000.00 | 2,480 | 101.600.00 | 18.5 | 0 | 0.0% | 250 |
| 1.3 K | 0.0% | 0 | 32.7 | 109.150.00 | 2,520 | 162.350.00 | 27.0 | 0 | – | 0 |
| 500 | 0.0% | 0 | 48.0 | 159.950.00 | 2,560 | 183.500.00 | 25.8 | 0 | – | 0 |
| 9.0 K | +12.5% | 4.5 K | 27.6 | 60.75−19.25 | 2,600 | 150.000.00 | 0.0 | 0 | 0.0% | 750 |
| 1.5 K | −14.3% | 250 | 27.9 | 51.45−30.55 | 2,640 | 230.050.00 | 22.5 | 0 | – | 0 |
| 7.5 K | 0.0% | 1.0 K | 28.0 | 42.50−4.50 | 2,680 | 255.350.00 | 19.9 | 0 | – | 0 |
| 1.3 K | 0.0% | 0 | 32.0 | 48.000.00 | 2,720 | 281.900.00 | 15.1 | 0 | – | 0 |
| 0 | – | 0 | 45.6 | 89.150.00 | 2,760 | 309.600.00 | 0.0 | 0 | – | 0 |
| 0 | – | 0 | 45.3 | 78.700.00 | 2,800 | 338.600.00 | 0.0 | 0 | – | 0 |
| 0 | – | 0 | 0.0 | 0.000.00 | 2,840 | 0.000.00 | 0.0 | 0 | – | 0 |
| 0 | – | 0 | 0.0 | 0.000.00 | 2,880 | 0.000.00 | 0.0 | 0 | – | 0 |
| 0 | – | 0 | 0.0 | 0.000.00 | 2,920 | 0.000.00 | 0.0 | 0 | – | 0 |
| 0 | – | 0 | 0.0 | 0.000.00 | 2,960 | 0.000.00 | 0.0 | 0 | – | 0 |
| 0 | – | 0 | 0.0 | 0.000.00 | 3,000 | 0.000.00 | 0.0 | 0 | – | 0 |
| 0 | – | 0 | 0.0 | 0.000.00 | 3,040 | 0.000.00 | 0.0 | 0 | – | 0 |
Unlock 30+ free options tools
The live TCS option chain - streaming prices, Greeks, every strike, what-if on price, IV and days - next to open interest, max pain, strategy builder and FII/DII data. One free account, no payment.
Used by 17 lakh+ traders · Real-time NSE & BSE · No payment required
Create free account- Max pain / option pain
- Option chain + Greeks
- Open interest analysis
- Multi-strike OI chart
- PCR & Modified PCR
- Strategy builder
- FII / DII data
- IV analysis
- Futures OI
- OI buildup
- Trade with 16 brokers
- Alerts & triggers
How to read the TCS option chain
Calls are on the left, puts on the right and strikes down the middle, with the at-the-money strike highlighted. Calls below the price and puts above it are in the money (shaded). For each option you see its premium (LTP) and its change since the previous close, open interest and its change, volume and implied volatility.
Open interest shows where positions are held: large call OI above the price is usually read as resistance and large put OI below it as support. The ATM straddle - the call and the put at the ATM strike together - is what the market charges for a move either way, so its price over the underlying is the move the chain is pricing in by expiry.
Learn it on video
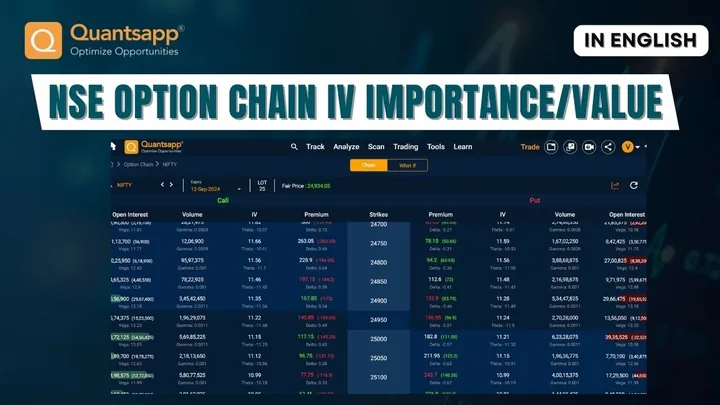 20:09Implied Volatility in the Option Chain: Why IV Matters
 23:24How to Read the Option Chain: OI, Volume, IV and Greeks
 24:00Option Chain, OI, Volume and Greeks: Reading Analytics
Frequently asked questions
What is the ATM strike of TCS today?
For the 25 Jan 2027 expiry, with the future at 2,442.20, the at-the-money strike is 2,440.
How much move is the TCS option chain pricing in?
The ATM straddle (call + put at 2,440) costs 328.95: about ±13.5% by 25 Jan 2027, a range of roughly 2,113 to 2,771.
Where is the highest open interest in the TCS option chain?
Calls: 2,600 (9.0 K shares). Puts: 2,400 (14.3 K). Across all 46 strikes the put-call ratio of OI is 0.85, and max pain is 2,480.
What is an option chain?
An option chain lists every call and put of an underlying for one expiry, strike by strike: the premium (LTP) and its change, open interest and its change, volume and implied volatility. Calls are on the left, puts on the right, strikes in the middle.
How do you read an option chain?
Start at the at-the-money strike, nearest the price. Calls below it and puts above it are in the money (shaded). Big open interest shows where writers hold positions - heavy call OI above the price is read as resistance, heavy put OI below it as support - and the ATM straddle premium shows how big a move the market expects by expiry.
How often does this option chain update?
Every minute during market hours. After the close it shows the last traded values of the day; the time of the data is shown above the table.
More for TCS
Option chain for other symbols
Data is for information only and is not investment advice. Derivatives trading carries substantial risk. Disclaimer