


Watch in the Quantsapp appFree. The full video library, your progress, and IV Chart live with market data.
Open in appVolatility is often seen only as a risk, but it can also be traded. This webinar shows how to identify volatility opportunities in Nifty, BankNifty and stock options.
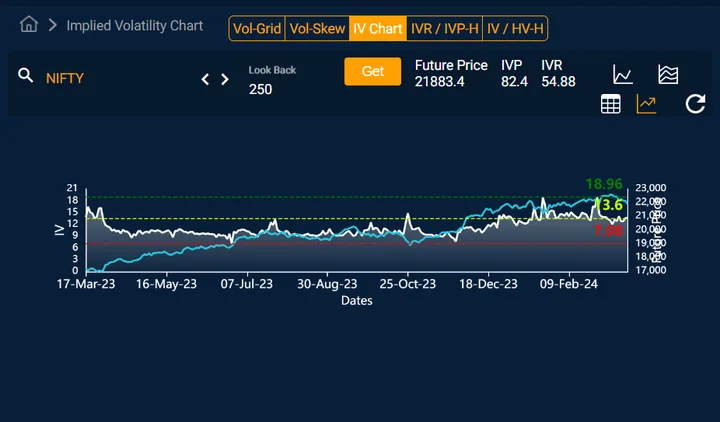
It uses Quantsapp's IV Chart, which tracks current and historical implied volatility, to judge where IV stands and how to construct option strategies around expected changes in volatility.
What you’ll learn
✓Volatility as a tradable factor
✓Reading current and historical IV
✓Using the IV Chart
✓Building strategies around volatility

SPEAKERDharmendra RajbharTrainer
PGDM in finance, having 5+ experience in Equity, commodities , forex analysis and trading.
All 419 videos by Dharmendra →