Use options volumes to trade swiftly at the top
Volume PCR can help you get the first sight of the turnaround. Quick turns in the range can give us insight into the series of quick small moves to trade that will help you keep up with the rapidly changing direction of the market.
F&O Cues
Shubham Agarwal
We have been trading near an all-time high market. While we have not seen a big pullback after posting those highs, we did see small drops. Essentially, when we are in such a set up, we do not want to be caught on a buy trade near the highest level of the market. On the other hand, we don’t want to miss if the market has to post yet another big move up either.
Solution to this dilemma is to ride the wave of short-term trends and trading small and often. This may seem like a solution, but we still need a solid basis which can help us identify such short-term movements in the market.
As we all know, apart from the price the futures and options market have one more key data point of Volume that indicates the action plan, or more importantly the interest points. Volume has been one of the oldest and most reliable indicators of what is interesting according to the market participants.
Turning to the F&O instruments, we have 2 kinds of options Call & Put. One is an option to buy (Call) and another is an option to sell (Put). This makes it easier to label the mood of the action picked up by the Volume.
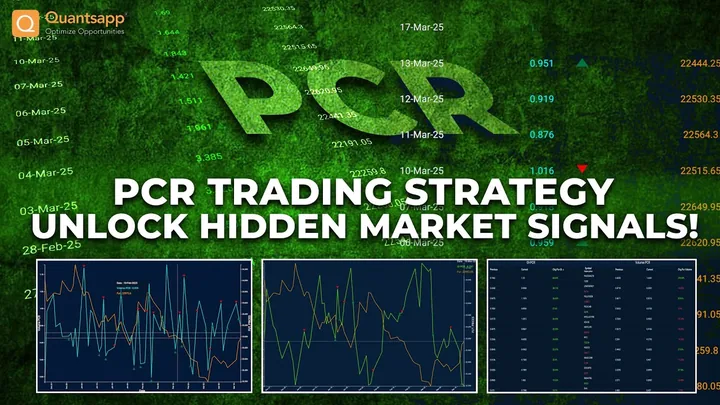
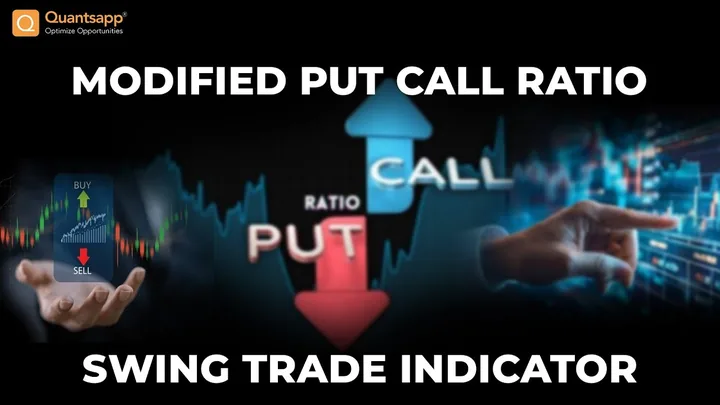
Joining both of them, we can have a super handy short-term trend indicator called the Volume Put Call Ratio.
Volume Put Call Ratio = (Total Put Option Volume / Total Call Option Volume) of any particular Symbol’s Options
Here, ‘Total Volume’ refers to the volume of all strikes and all expiries of Call or Put options. Reading it is also simple. Higher Put Volume will push the ratio higher and comparatively higher Call Volume will pull the ratio down.
There are 3 key characteristics we should consider while making use of this trade data.
-
Just like the trend, dominance of either Call or Put volume, historically, continues for a short period of time.
-
Volume PCR is such that trade data moves only in range. For example, for Nifty it has been seen moving in a fine range of 0.7-1.3 over the last 3 years.
-
Last and the most important characteristic of Volume PCR is that it is negatively correlates with the symbol price. This means that Volume PCR often rises during the fall in the symbol price and often falls during the rise in symbol price.
This combination of negative relationship and the range bound nature of Volume PCR can help us in gauging short-term insight about the small ups and downs. Now, if we simply follow this and as soon as we see Volume PCR at a recent bottom (where there are higher chances of it rising from there), we create a cautious view for the symbol price. This is because rising Volume PCR is often seen alongside a falling symbol price.
Volume PCR can help you get the first sight of the turnaround. Quick turns in the range can give us insight into the series of quick small moves to trade that will help you keep up with the rapidly changing direction of the market.
First published on 13 Jan 2024: prices, lot sizes and expiries are those of that time. They are illustrations for education only, not investment advice. Derivatives trading carries risk; read all scheme and risk documents before trading.