Carry forward trades with confidence using Volume PCR: Shubham Agarwal!
More Puts being traded means we have a lot of traders using Puts to place their trading bets. This means lot of bearish trades are being taken. This will lead to higher Volume PCR.
Markets have been indecisive in the last few weeks. This always raises the question, should I carry forward my trade taken during the day or not. The very unreliability of the trend to continue puts the future of any directional trade in danger of a loss.
There is no definite way of making sure the current view will continue. However, it is possible to take an indicative signal from the trading activity today about the direction tomorrow. This helps in creating a supporting argument.
The indicator for such signal is Volume Put Call Ratio.
Volume Put Call Ratio = Volume of Put Options / Volume of Call Options for the day. Consider volume of all the expiries.
Unlike other indicators this is straightforward. More Puts being traded means we have a lot of traders using Puts to place their trading bets. This means lot of bearish trades are being taken. This will lead to higher Volume PCR.
Typically, due to this we do have a negative correlation between Volume PCR and the underlying price. Rising Volume PCR would more often be associated with a falling underlying and falling Volume PCR would more often be associated with a rise.
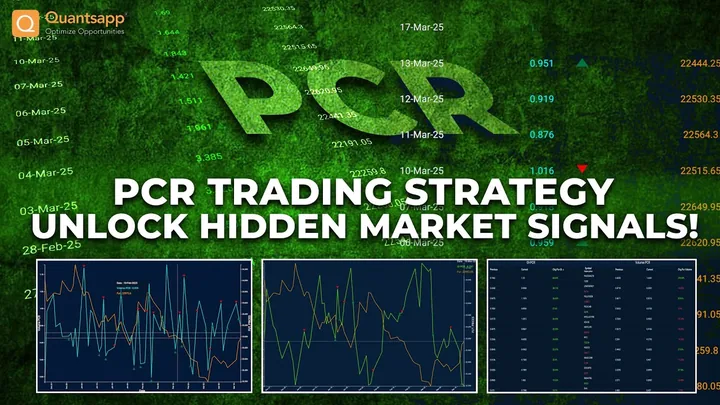
This can be seen from the figure up here. The chart has Volume PCR and Future price of Reliance from over 3 months old data to get a taste of the relationship.
Few notables here.
-
The Stock and Volume PCR have reasonable and more so visible negative correlation.
-
The tops and bottoms for a very short-term for both indicator and Future price are coinciding with each other.
-
Just like the stock, the PCR also trends with the Future most of the times maintaining the negative relationship.
Let us now figure out how to make an indicative decision from this data of carrying forward the trade.
First of all, let us freeze the time of evaluation of Volume PCR. The indicator is based on volume that keeps getting clocked during the day. So, looking at it at the beginning of the day or for that matter even halfway through the day may lead to errors. So, best is to look at it during the end of the day. In our case the need for evaluation will come during the end of the day only.
As can be seen from the small example there the ratio does not respect neutrality at 1 and many trade for months below 1. So, keeping a fix number to define the continuity is not a good idea.
Compare the number from yesterday is what I do. Following are the basic observations that can be used as a guide based on the 3 notables.
-
If the Volume PCR reading during the closing hours is lower than yesterday, the likelihood of the positive move is higher.
-
If Volume PCR has risen as compared to yesterday, then the likelihood of a falling price is higher for the next day.
Data of Volume PCR is easily available on many analytical platforms or can also be calculated using publicly available exchange provided data.
First published on 19 Jul 2025: prices, lot sizes and expiries are those of that time. They are illustrations for education only, not investment advice. Derivatives trading carries risk; read all scheme and risk documents before trading.