How to follow the trend using PCR OI
Markets don't move in straight lines. They bounce on the way down and pull back on the way up. That's exactly what catches traders out, confusing a retracement for a reversal.
Every trader has been there. The market is in freefall. Every chart looks oversold. And somewhere in the back of your head, a voice says: “It has to bounce soon.” So you step in. And the market drops another 1%.
Geopolitical shocks don’t just move markets. They trap traders. The Iran-Israel conflict is a case in point. Indian markets have been falling day after day. Traders keep stepping in at what looks like support, only to watch the market make a fresh low. The real question is: how do you follow the trend?
There’s one piece of data that can help. It’s called PCR OI, and once you know how to read it, trading a trending market gets a lot clearer.
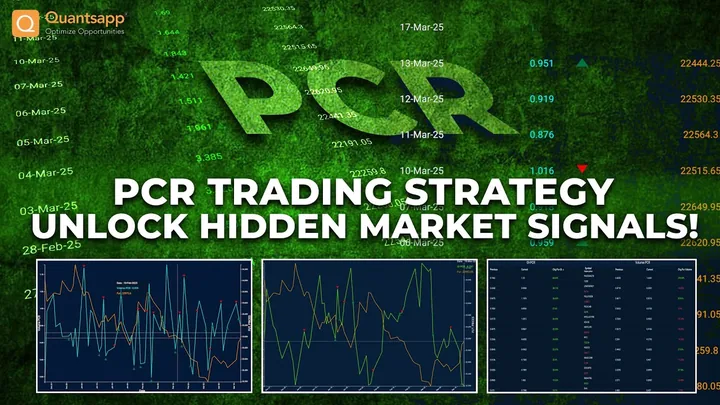
PCR stands for Put-Call Ratio. The OI version uses Open Interest:
PCR OI = Total Put OI / Total Call OI
To understand what this tells you, start with Open Interest itself.
Unlike shares, where a fixed number exists, options contracts are created in real time. When a new buyer and seller come together and open a trade, they create one contract of Open Interest. It’s a live count of all active positions in the market. You can check OI on various free platforms, or even on the NSE website.
Now here’s what most traders miss. OI is created by both buyers and sellers, but they’re not equal. Option sellers take on large, open-ended risk to collect a small premium.
Buyers risk only the premium they pay. Sellers also put up futures-level margin. Because of this, sellers carry more weight. They have more skin in the game, and their positioning reflects genuine conviction about market direction. Read OI from the seller’s point of view. That’s where the signal lives.
An option seller’s view is simple: put sellers are bullish, call sellers are bearish.
Apply that to PCR OI. When put OI rises faster than call OI, the ratio climbs. More put sellers entering the market means more bullish conviction from the informed side. PCR rising is a bullish signal. PCR falling means call sellers are in charge, which is bearish.
Price and PCR tend to move together. They are directly proportional.
Here’s how to trade it:
-
PCR rising means the trend is up. Buy the dips. Use your own setup to time entries, but trade with the trend.
-
PCR falling means the trend is down. Sell the rallies. Resist the urge to bottom-fish just because the chart looks oversold.
Follow those two rules consistently, and you’ll stop fighting the market.
Markets don’t move in straight lines. They bounce on the way down and pull back on the way up. That’s exactly what catches traders out, confusing a retracement for a reversal.
PCR OI cuts through that noise. It gives you a read on what the informed, risk-taking side of the market actually believes. Follow it, trade with the trend, and stop guessing at bottoms
First published on 14 Mar 2026: prices, lot sizes and expiries are those of that time. They are illustrations for education only, not investment advice. Derivatives trading carries risk; read all scheme and risk documents before trading.