Answer to how much fall is too much? IVR/IVP
Once we know that the IV is in an extreme zone, prepare for an opposite move in the Underlying.
F&O Cues
Shubham Agarwal
Indian Equities fell dramatically after a long time. In the times of fall what scares us more is the speed of the fall. But as they say, there is always an opportunity in disaster. So, such big falls have a high probability of reversing also at a similar speed.
While options trading has been very widely used mainly for such opportunities only, we still have a tough question to answer, how much is too much fall for us to look for bargain hunting? Well, the answer is simpler to find than we feel, but for that, we will have to understand a key data point of Options Premium, Implied Volatility.
Options Premium (Call/Put) is made up of 5 variables viz.
• Underlying Price,
• Strike Price,
• Time to Expiry,
• Interest Rate
• & Volatility.
The first 4 of the 5 factors are publicly available information. A simple equation with the rest of the 4 known variables and the answer of Premium (given by market price) can give us the volatility figure.
Now how do we find the extremes?
Two unique characteristics of Options
-
Negative correlation between Symbol Price & Implied Volatility
-
IV is range bound.
So, now once at the Upper End of IV, we have a Big Chance of IV falling and Symbol Price rising.
To find the extreme, just plot implied volatility (which can be found using several free software on the web) of the nearest strike Call/Put of any underlying for at least 60 preceding days (an approximation for 3 expiries). Just visually observe the high point and low point. One would easily realize the extreme as well as the mean reverting characteristic.
Over and above that there are popular gauges used wide like IVR, and IVP, which would denote in just one number if we are in the high bracket or low bracket of volatility. Finding the value of these gauges is also not that difficult, any value of either of these below 10 is a low IV bracket, and above 90 is a high IV bracket.
Where IVR = (Highest IV – Current IV) / (Highest IV – Lowest IV)
IVP = Number of Day Current IV is above the past 250 days IV / 250
Once we know that the IV is in an extreme zone, prepare for an opposite move in the Underlying. Meaning with IV at the upper extreme typically we would have fallen, but we would be nearing a bottom.
If we look at recent times, both IVR and IVP in NSE Nifty were at 90, the day NIFTY ended close to 21500. Then came the halt in the fall at least. Do we go up in the next 2 days to the same high, we do not know but we do know that we may not fall at the same speed as the higher IV can not keep rising, up and away like the stocks that we see.
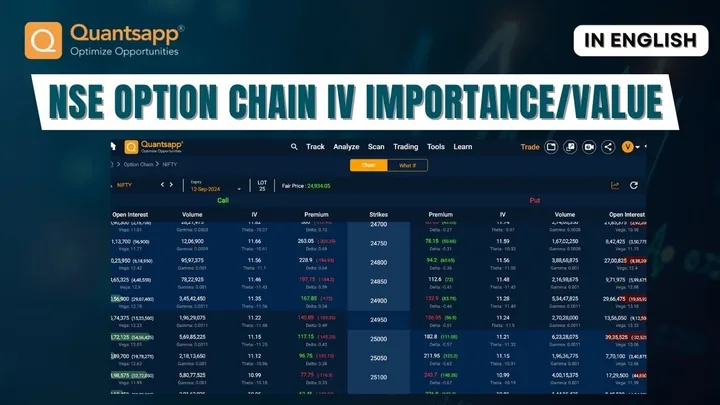
Lastly calculating IV is difficult but Option Chain will always help in getting the data more over India VIX can be a good proxy to Nifty’s IVs.
First published on 21 Jan 2024: prices, lot sizes and expiries are those of that time. They are illustrations for education only, not investment advice. Derivatives trading carries risk; read all scheme and risk documents before trading.