


Trade Stronger Stocks: Setups Based on Relative Performance
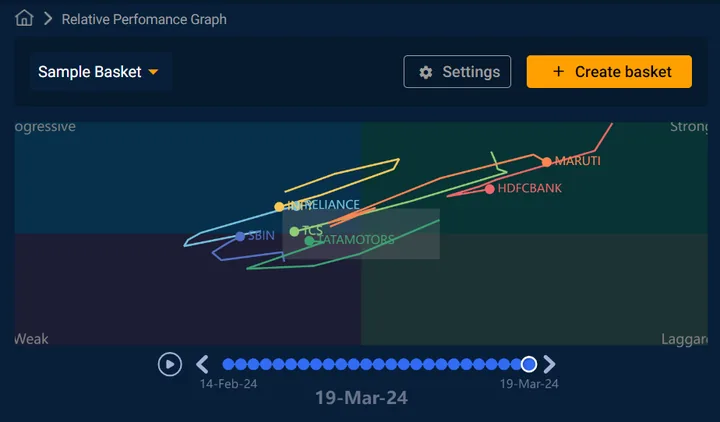
Relative Performance Graph, helps in spotting the leaders in the Indian stock markets, especially in the F&O segment, by early recognition of outperformers relative to the index under consideration. The indices could be Nifty or BankNifty etc., depending on the choice of the underlying stocks.
Each asset or stock under study is plotted as a dot on a scatter plot with the relative performance to Nifty or BankNifty etc. on the horizontal axis and Momentum (proprietary variable) on the vertical axis.

SPEAKERDharmendra RajbharTrainer
PGDM in finance, having 5+ experience in Equity, commodities , forex analysis and trading.
All 419 videos by Dharmendra →