


How to find Momentum Stocks using Screeners | Quantsapp Screeners Explained
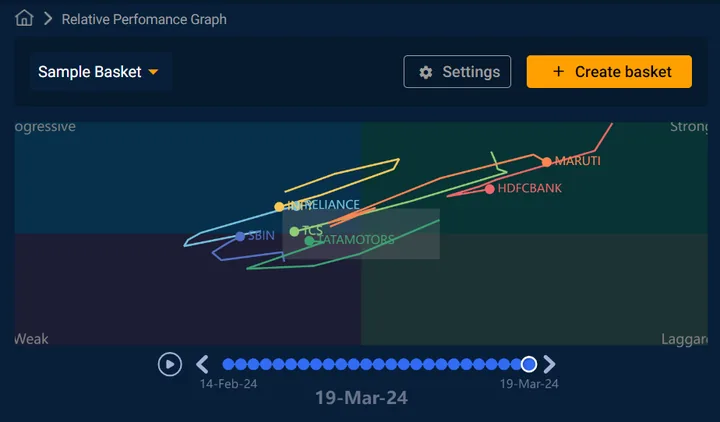
Take advantage of the Relative Performance Graph's power to improve your trading techniques for stocks in F&O segment of NSE. We'll get deep into the Relative Performance Graph in this extensive video-tutorial, which is an essential tool for traders to compare the performance of several stocks or indices.
Learn how to interpret and understand the Relative Performance Graph so that you can make wise trading choices for swing and positional trading. How to effectively deploy Relative Performance tool in the trading and seeking outperformers in Nifty, BankNifty or sectors pertaining to Indian stock market.

SPEAKERDharmendra RajbharTrainer
PGDM in finance, having 5+ experience in Equity, commodities , forex analysis and trading.
All 419 videos by Dharmendra →