


SWING TRADING STRATEGY. FIND THE BEST STOCK FOR YOU.
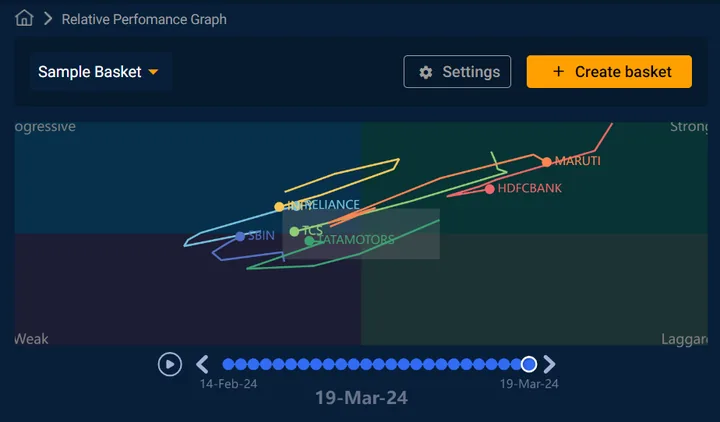
In this video, the effectiveness and characteristics of a proprietary tool created by Quantsapp, referred to as the Relative Performance Graph is observed. This graph segments the space into quadrants: weak, progressive, strong, and laggard, showcasing the momentum-driven positioning of different stocks in relation to indices like Nifty or BankNifty. It portrays shifts of stocks from weak to progressive or strong to laggard, suggesting possible rises or falls in individual stocks, respectively.
The tool helps investors visualize both the leading momentum stocks and the underperforming ones within the basket, relative to a benchmark. This functionality allows traders to identify market trends and rotations, helping them make informed decisions about sector rotations and momentum stocks on the NSE, particularly in the F&O segment.
How can one leverage these occurrences to devise option strategies, whether it's capitalizing on bullish enthusiasm or navigating bearish trends that might impact the pricing of the underlying asset? This insight enhances option traders' ability to identify such fluctuations with just a quick glance.

Seasoned derivatives expert with over 6 years of experience across equities, derivatives, and commodities markets. With a proven track record of successful trading and deep market insights.
All 203 videos by Ankit →