


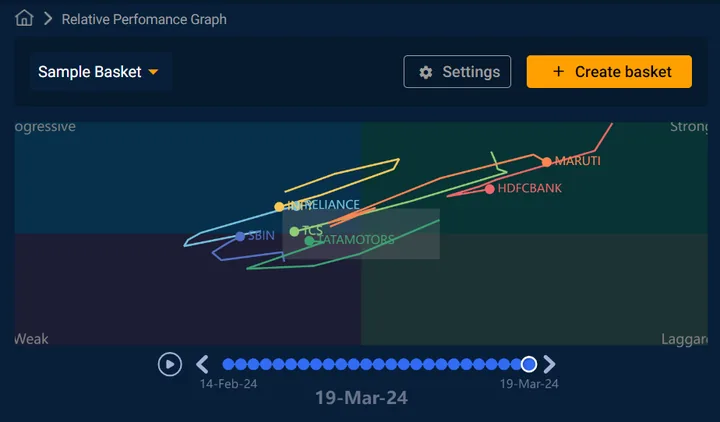
Stocks That Lead, Strategy That Follows.
📈 Mastering Outperformer Selection with Relative Performance Graphs
Unlock the secrets to pinpointing market leaders and executing strategic trades with our in-depth tutorial on relative performance analysis. In this video, we'll guide you through:
Understanding Relative Performance Graphs: Learn how to compare individual stocks against benchmarks to identify true outperformers.
Utilizing Relative Rotation Graphs (RRGs): Discover how RRGs can visually represent the momentum and strength of various assets, aiding in sector rotation strategies.
Implementing the Price Relative Indicator: Gain insights into calculating and interpreting this indicator to assess a stock's performance relative to its sector or index.
Practical Trading Strategies: Apply these tools to real-world scenarios, enhancing your decision-making process and trading outcomes.
Whether you're a novice investor or a seasoned trader, this tutorial will equip you with the analytical skills to identify and capitalize on market outperformers effectively.

Seasoned derivatives expert with over 7 years of experience across equities, derivatives, and commodities markets. With a proven track record of successful trading and deep market insights.
All 203 videos by Ankit →