


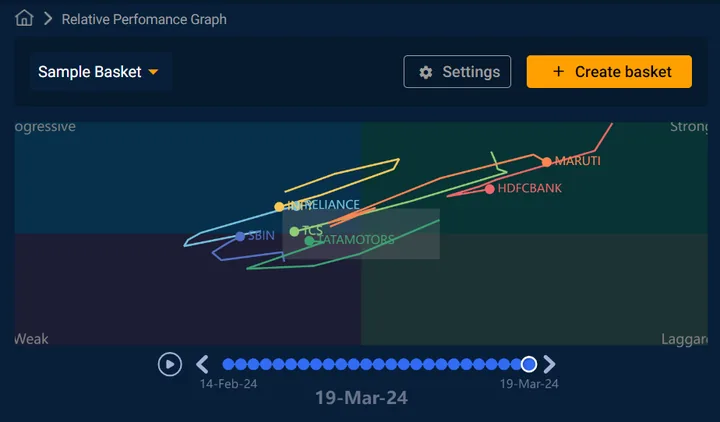
Relative Performance Graph
Option traders and other derivative traders on NSE would like to pre-empt the large moves which are about to unfold in any particular underlying, especially stocks in F&O segment. How do traders spot them early and build an edge for their trading.
The efficacy and functionality of an important proprietary tool by Quantsapp, namely, Relative Performance Graph, helps in this regard.
With the graph space divided into quadrants, namely, weak, progressive, strong, Laggard. It indicates the momentum-based positioning of different scrips with Nifty or any other index like BankNifty etc., their respective state transitions from weak to progressive or strong to laggard, suggestive of a possible surge or drop in that particular scrip.
What you’ll learn

He has been a programmer himself in 10+ programming languages. With 20+ years of professional experience in Research & Advisory he has also been one of the pioneers of ROBO advisory in Indian Market. He is a known face on business media for his take on markets and trading strategies
All 21 videos by Shubham →