


Find Option Bottom | RR 1:3 (मराठी मध्ये)
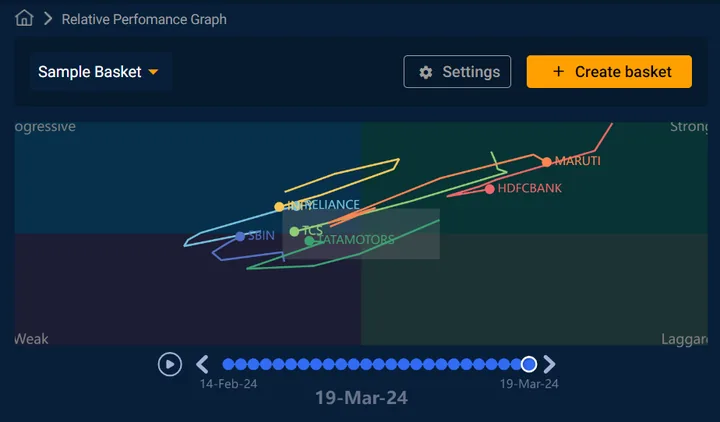
This video explores the effectiveness and features of a proprietary tool developed by Quantsapp, known as the Relative Performance Graph. The graph divides the space into quadrants: weak, progressive, strong, and laggard, demonstrating the momentum-based positioning of various stocks relative to Nifty or other indices such as BankNifty. It illustrates transitions of stocks from weak to progressive or strong to laggard, indicating potential surges or declines in specific stocks. The tool helps investors visualize both the leading momentum stocks and the underperforming ones within the basket, relative to a benchmark. This functionality allows traders to identify market trends and rotations, helping them make informed decisions about sector rotations and momentum stocks on the NSE, particularly in the F&O segment
Know Historical Monthly return on stocks/ Indices, Decode the historical trend of returns of Individual stocks and Indices for Month-On-Month/ Year-On-Year Using Seasonality Tool.
What you’ll learn

Prasanna Jadhav is a certified options specialist with a wealth of knowledge and research in technology and financial markets. His knowledge of options trading and insights are very helpful , establishing himself as one of the top expert for acquiring insights into Equity Derivatives Trading.
All 242 videos by Prasanna →