


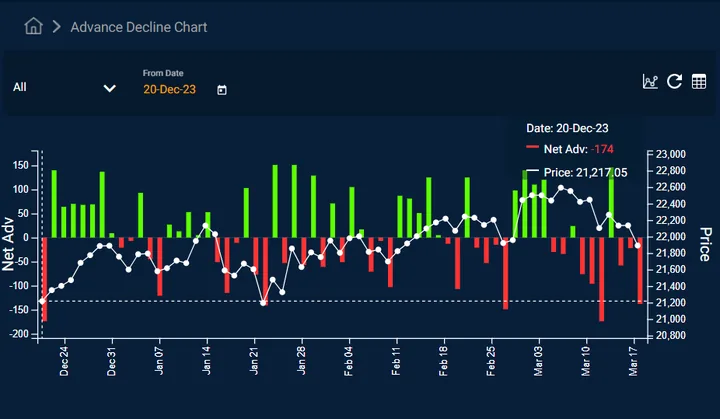
Advance Decline Chart
The Advance Decline chart, a tool within Quantsapp utilized in the Indian stock market, gauges the breadth of a market's movement. It aids investors and traders in evaluating the overall strength or weakness of a market by monitoring the number of advancing and declining stocks, thus determining the net advances.
Here's how it functions:
Advance: When a stock's closing price exceeds the previous day's close, it's considered an advancing stock.
Decline: Conversely, when a stock's closing price is lower than the prior day's close, it's considered a declining stock.
What you’ll learn
✓Understanding of advance and decline
✓What is market breadth?
✓Approach to understanding sentiment via Advances and declines
✓Sector wise analysis of stocks

SPEAKERVarun ShettyTrainer,Quantsapp
Varun Shetty possesses rich experience in the field of training, he is amongst the best experts for gaining an understanding of Equity Derivatives Trading
All 124 videos by Varun →