


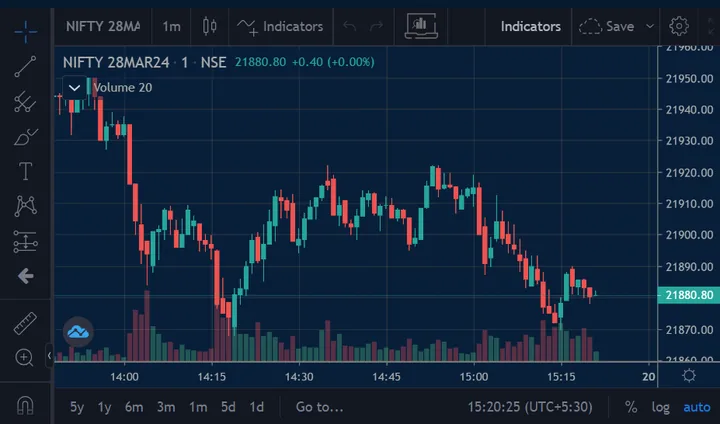
The Secret to Successful Stock Market Analysis: How to Read Stock Charts
Chart analysis is a method of analyzing financial markets by studying historical price and volume data to identify patterns and trends. The goal is to use these patterns to predict future price movements.
Chart analysis is a branch of technical analysis, which is based on the idea that past price movements can indicate future price movements. Technical analysts, also known as chartists, use a variety of tools and techniques to analyze charts, including: trendlines, indicators, chart patterns, and candlestick charts.

SPEAKERDharmendra RajbharTrainer
PGDM in finance, having 5+ experience in Equity, commodities , forex analysis and trading.
All 419 videos by Dharmendra →