


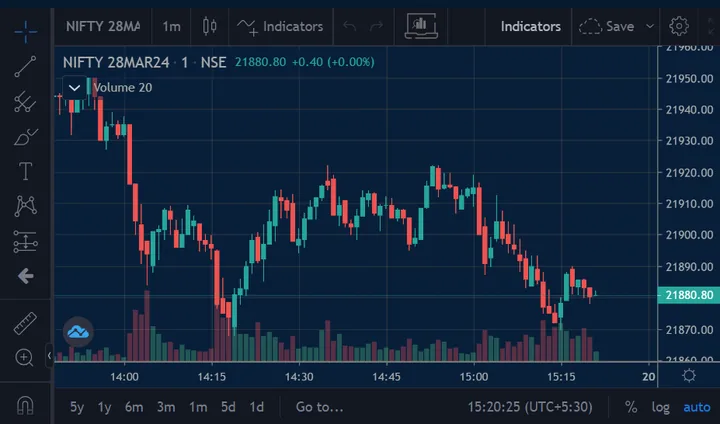
Secret Patterns for Intraday Success: Analyze Charts Like a Pro!
In this video, we dive deep into two powerful chart patterns: flags and triangles. Learn how to spot bullish and bearish flags, and discover the key differences between ascending and descending triangles. Whether you’re new to trading or looking to sharpen your technical analysis skills, these patterns can provide insights into market direction and potential breakout opportunities.
We’ll cover:
What is a bullish flag and how it signals a potential uptrend
How to identify a bearish flag that might precede a downtrend
Understanding the ascending triangle and its implications for price breakouts
The role of the descending triangle in predicting downward movements
Chart patterns like these can offer crucial hints about future price action, so mastering them is essential for traders. Watch now to enhance your technical analysis game!

Seasoned derivatives expert with over 6 years of experience across equities, derivatives, and commodities markets. With a proven track record of successful trading and deep market insights.
All 203 videos by Ankit →