


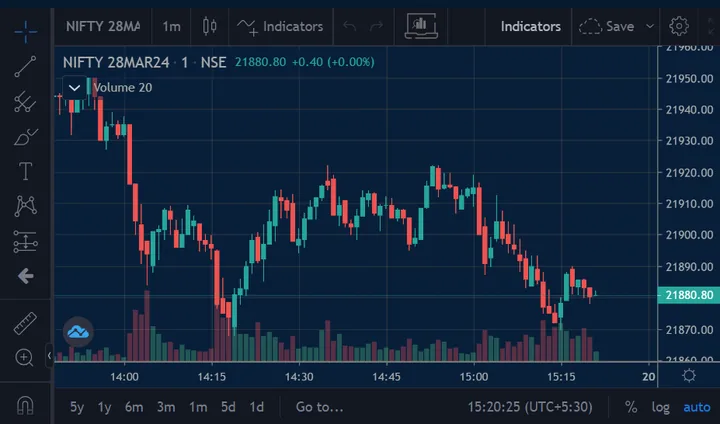
Retest Confirmation: Price Rebounds from Trendline Support
In trading, a trendline is a fundamental tool used in technical analysis to help traders identify and visualize trends in the market. It’s essentially a straight line drawn on a chart to connect specific price points, typically the highs or lows, to indicate the general direction of the market's movement over a given period.
Here’s how trendlines are commonly used:
Uptrend Line: This is drawn by connecting two or more significant low points (support levels) in the price chart. It shows the market is trending upward, and it signals buying opportunities when the price bounces off the trendline.
Downtrend Line: This is drawn by connecting two or more significant high points (resistance levels) on the chart. It suggests the market is trending downward, signaling selling opportunities when the price falls to the trendline.
Sideways Trend: If the market doesn’t show a clear upward or downward movement, you might see a horizontal trendline. This indicates a period of consolidation where the price is moving within a range, and traders often use it to spot potential breakouts or reversals.

PGDM in finance, having 5+ experience in Equity, commodities , forex analysis and trading.
All 419 videos by Dharmendra →