


Top Swing Trading Strategies with Quantsapp Indicators
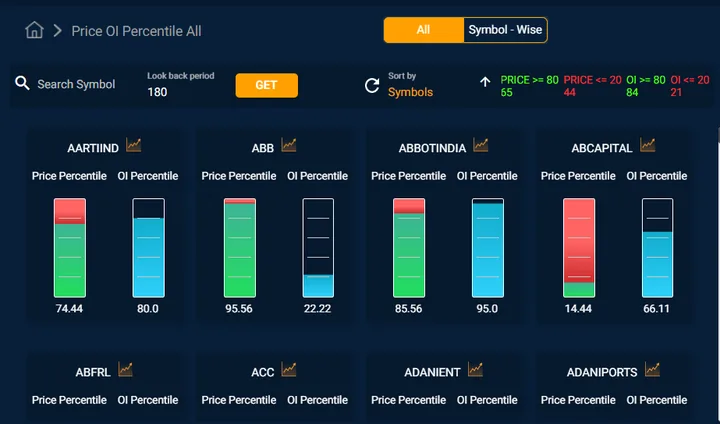
Swing trading becomes more powerful with the combination of Price Action and OI Percentile Analysis. By integrating these two key metrics, traders can identify high-probability setups and ride short- to medium-term market trends effectively.
Price Analysis: Analyze price movements to determine critical levels of support, resistance, and trend direction. Price action reveals where the market is gaining or losing momentum.
OI Percentile: Measure open interest (OI) percentile to gauge the strength of market participants' positions. High OI percentile in a trending stock indicates strong conviction, while low OI percentile may signal indecision or exhaustion.
Combine Price and OI Trends: Look for alignment between bullish price movement and high OI percentile for long trades or bearish price action with high OI percentile for short trades.
Identify Trend Reversals: Spot reversals when price action conflicts with extreme OI percentile values, signaling potential unwinding or covering.
Confirm Swing Opportunities: Use price consolidation zones combined with OI percentile shifts to validate breakout or breakdown trades.
This strategic combination provides a data-driven edge, ensuring precision and profitability in swing trading.

Seasoned derivatives expert with over 6 years of experience across equities, derivatives, and commodities markets. With a proven track record of successful trading and deep market insights.
All 203 videos by Ankit →