


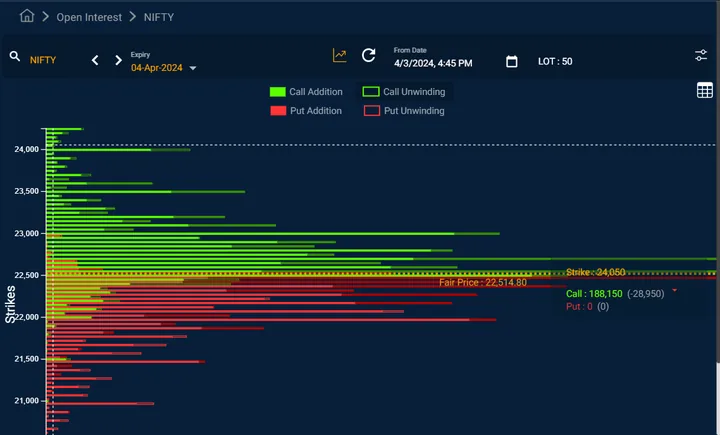
What is open interest in stock market | how to analyse open interest data | OI in options trading
Directional options trading using open interest involves analyzing the open interest of options contracts to make informed decisions about the likely direction of the underlying asset's price movement. Open interest refers to the total number of outstanding options contracts for a particular strike price and expiration date. Traders often use open interest as a key metric to gauge market sentiment and potential price trends. Here's a breakdown of how directional options trading using open interest works:
1. Understanding Open Interest: • Open interest represents the total number of options contracts that have been initiated but not yet closed or exercised. • High open interest suggests strong market interest and liquidity, while low open interest may indicate less active participation.
2. Identifying Trend Strength: • An increase in open interest along with a rising stock price suggests a strong bullish trend. • Conversely, an increase in open interest coupled with a declining stock price may indicate a strong bearish trend. • Traders often look for confirmation of a trend by analyzing price movements alongside changes in open interest.
3. Spotting Potential Reversals: • A divergence between the direction of the stock price and open interest could signal a potential reversal. • For example, if the stock price is rising, but open interest is decreasing, it may indicate weakening bullish momentum.
4. Focus on Key Strike Prices: • Traders often pay attention to specific strike prices with significant open interest as these levels can act as support or resistance. • High open interest at a certain strike price suggests a considerable number of market participants have a vested interest in that price level.

5+ years of market experience, mentored several people in options trading. Sound understanding of the concept of demand and supply zones using option strategies.
All 130 videos by Vigneshwar →