


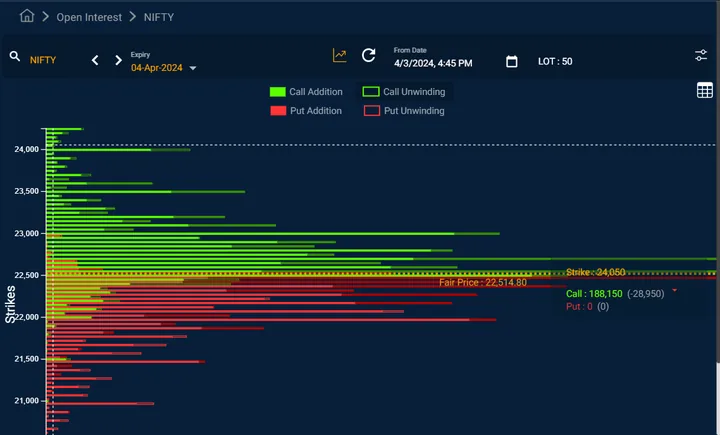
The Foundation of Price Action: Understanding Support and Resistance
Traders and analysts chart the movements of stock prices over time to pinpoint the support levels and resistance levels that indicate optimal times to buy and sell.
Support and resistance are two foundational concepts in technical analysis. Understanding what they are and how they work is essential to correctly reading a price chart.
Technical analysis acknowledges that all stocks rise and fall in price constantly in response to supply and demand. By zeroing in on movements within a timeframe, they seek to identify patterns. A stock's price may maintain a support level, below which its price won't drop. It may also show a resistance level, at which buyers back off.

PGDM in finance, having 5+ experience in Equity, commodities , forex analysis and trading.
All 419 videos by Dharmendra →