


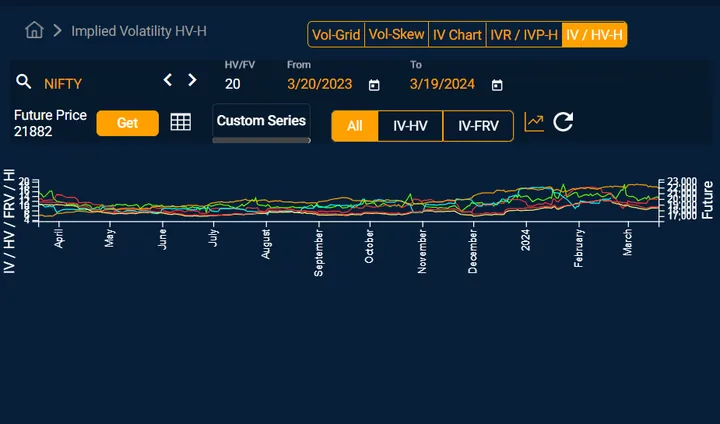
Unpacking Stock Market Volatility!
Unpacking Stock Market Volatility explores the intricacies of market fluctuations by examining two key metrics: Implied Volatility (IV) and Historical Volatility (HV). These metrics offer powerful insights into market sentiment and risk, as they allow us to gauge the degree of expected and actual price movement over time.
In our analysis, Implied Volatility reflects the market’s expectations for future volatility derived from options pricing. It provides a forward-looking view, allowing traders to anticipate potential price swings and understand how uncertain the market perceives the future. In contrast, Historical Volatility is based on actual past price changes, giving a backward-looking measure of how much a stock’s price has fluctuated over a set period. By comparing IV and HV, we can determine whether the market's current expectations align with past performance, offering a clearer picture of current market dynamics.
Leveraging this analysis, we've developed targeted strategies tailored for both buyers and sellers. For buyers, strategies emphasize capitalizing on low IV to obtain options inexpensively, positioning for significant price movements that may lead to high returns. For sellers, strategies focus on high-IV scenarios where premiums are elevated, enabling them to generate income by selling options and potentially profiting from the decay of overpriced volatility. Our approach empowers traders to make informed decisions by aligning their strategies with prevailing market volatility, maximizing potential returns, and managing risk more effectively.

Seasoned derivatives expert with over 6 years of experience across equities, derivatives, and commodities markets. With a proven track record of successful trading and deep market insights.
All 203 videos by Ankit →