


Post Market Analysis || 26th December 2024 ||
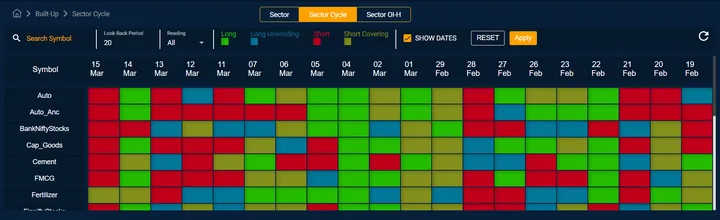
In this video we have tried to explain the scenario of Built-up breadth. As the name suggests, it is a cross-sectional analysis of built-up in the market scrips, especially the ones listed in the NSE derivatives segment. It is at a particular juncture; being measured every 1, 3, 5, 10 minutes, as indicated in the drop-down menu of the tool.
Analysis of Futures Price and Open Interest, being labelled with 4 different labels, as shown ahead:
Longs = Price Up + OI Up (L)
Long Unwinding = Price Down + OI Down (LU)
Shorts = Price Down + OI Up (S)
Short Covering = Price Up + OI Down (SC)
In order to understand the sentiment governing the financial market is indicated by the ratio of price up scenarios to total scenarios, i.e.
(L+ SC)/(L+LU+S+SC)
If this ratio is greater than 0.65, suggestive of greater segment of the market stock futures in the Long or Short Covering mode, i.e. suggesting that positive vibe of prices is strong and the breadth is sound.
While if,
(S+LU)/(L+LU+S+SC) gives a ratio greater than 0.65 suggests that the stock futures on NSE exhibiting a price drop scenario are higher, suggestive of a bearish scenario.
So derivative data on NSE can be deployed to understand the sentiment and hence price forecasts and guesstimates can be arrived at. At Quantsapp, India’s largest options trading analytics platform, data and its study is emphasised. Be a data driven trader!
Option Traders can easily gauge the participants’ sentiments using Built-up Breadth in Quantsapp. Open Interest & Change in Futures OI help to decipher Market Participants' reaction to any move or event.
Be a data driven trader!

PGDM in finance, having 5+ experience in Equity, commodities , forex analysis and trading.
All 419 videos by Dharmendra →